
Meta description: I’ve debugged slow APIs at scale across multiple companies. Here’s what actually kills API performance in production — and the exact fixes I applied to recover it.
Last updated: May 24, 2025
Introduction
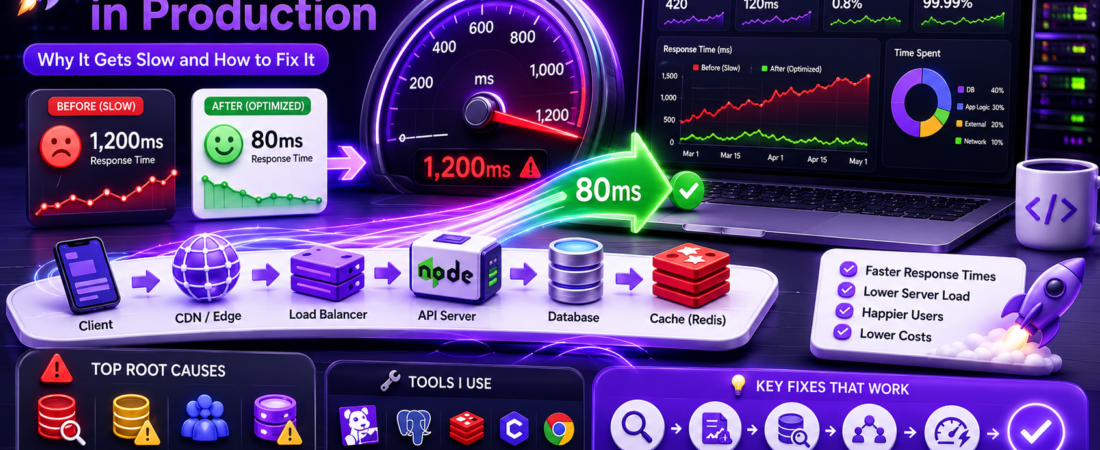
I’ve seen it play out the same way at three different companies. A new API ships, staging looks great, load tests pass — and then three months into production, response times quietly balloon from 80ms to 1,200ms. Nobody changed the code. Nobody changed the infrastructure. Traffic just grew, and something buckled.
API performance degradation in production is rarely a single cause. It’s almost always a combination of database query patterns that look fine under light load, missing indexes that become critical at scale, network latency that compounds across microservices, and caching strategies that were never validated under real traffic.
In this article, I’ll walk through every root cause I’ve personally encountered, the exact tools I used to find them, and the fixes that brought response times back down where they belonged.
TL;DR
- N+1 query patterns and missing database indexes are responsible for the majority of API slowdowns I’ve investigated at scale.
- Connection pool exhaustion and blocking I/O in async handlers silently destroy throughput under concurrent load.
- A layered caching strategy (database query cache → application cache → CDN/edge cache) can cut median response times by 60–80% without changing business logic.
Background / Why Production Performance Is Different From Staging
Staging environments almost never replicate what kills you in production. In staging, your database has a few thousand rows. In production, it has 50 million. Query plans that were fast on small datasets start hitting full table scans. Indexes that seemed unnecessary suddenly become the difference between 5ms and 4,000ms.
Concurrency is the other gap. Load tests simulate X requests per second, but they rarely simulate the realistic mix of request types, cache miss rates, and bursty traffic patterns that production actually delivers. Connection pools that handle 100 concurrent synthetic users in load testing fall over at 80 real concurrent users because real users hold connections open longer, retry on failure, and send larger payloads.
Understanding database query optimization, connection pooling, response caching, and async I/O is the foundation for solving API performance problems at any scale. [INTERNAL LINK: related article on database indexing strategies]
Prerequisites
You should have:
- Access to slow query logs on your database (MySQL, PostgreSQL, or MongoDB)
- An APM tool set up — I use Datadog APM or New Relic in production; locally I use
clinic.js - Basic familiarity with
EXPLAIN ANALYZEin PostgreSQL orEXPLAINin MySQL - Your API framework’s request timing middleware enabled (e.g., Morgan in Express, or built-in tracing in Fastify)
Step-by-Step: How I Diagnose and Fix Slow Production APIs
Step 1: Establish a Baseline with Request Tracing
Before fixing anything, I need data. I enable per-request timing logs across every layer: the API server, the database, and any external service calls. In Express.js, I use Morgan with a custom token:
morgan.token('response-time-ms', (req, res) => {
  if (!req._startAt || !res._startAt) return '-';
  const ms = (res._startAt[0] - req._startAt[0]) * 1e3
    + (res._startAt[1] - req._startAt[1]) * 1e-6;
  return ms.toFixed(3);
});

app.use(morgan(':method :url :status :response-time-ms ms'));
I also add a middleware that logs per-request database query counts. If a single request is firing more than 10–15 queries, that’s an immediate red flag.
Step 2: Identify N+1 Query Problems
The N+1 query problem is the single most common cause of API slowdowns I’ve encountered. It happens when you fetch a list of N items, then execute one additional query per item to fetch related data.
Here’s what it looks like in a typical ORM setup (using Sequelize as an example):
// BAD — N+1 queries: 1 query for orders + 1 per order for the user
const orders = await Order.findAll();
for (const order of orders) {
  order.user = await User.findByPk(order.userId); // fires once per order
}
In production with 500 orders on a page, that’s 501 database round-trips for a single API response. At 5ms per query, that’s 2,500ms just in database time.
The fix is eager loading — fetch everything in a single JOIN query:
// GOOD — 1 query with a JOIN
const orders = await Order.findAll({
  include: [{ model: User, required: true }],
});
I use sequelize-log-queries or enable logging: true during development to catch these before they hit production.
Step 3: Audit Missing Database Indexes
After fixing N+1 issues, I run EXPLAIN ANALYZE on every slow query flagged by my APM tool. The key thing to look for is Seq Scan (sequential scan) on large tables — that means Postgres is scanning every row instead of using an index.
-- Run this on any slow query
EXPLAIN ANALYZE
SELECT * FROM orders
WHERE user_id = 42 AND status = 'pending'
ORDER BY created_at DESC
LIMIT 20;
If I see Seq Scan on orders with a high row count, I add a composite index:
CREATE INDEX CONCURRENTLY idx_orders_user_status_created
ON orders (user_id, status, created_at DESC);
I always use CONCURRENTLY in production to avoid locking the table during index creation. This was a painful lesson — I once ran CREATE INDEX without it and locked a high-traffic table for 8 minutes at 2 p.m. on a Thursday.
Important: Adding too many indexes slows down write performance. Every INSERT, UPDATE, and DELETE has to update all indexes on the table. Profile your read/write ratio before adding indexes, and drop ones that aren’t being used. In PostgreSQL,
pg_stat_user_indexesshows index usage stats.
Step 4: Fix Connection Pool Exhaustion
One of the most deceptive performance killers is connection pool exhaustion. When all connections in the pool are in use, new requests queue up waiting for a free connection. From the outside, this looks like random slowdowns that don’t correlate with CPU or memory usage.
I add a pool monitoring query to catch this before it becomes critical:
// Log pool stats every 60 seconds (using pg-pool)
setInterval(() => {
  console.log({
    totalConnections: pool.totalCount,
    idleConnections: pool.idleCount,
    waitingRequests: pool.waitingCount,
  });
}, 60000);
When waitingCount starts climbing, the pool is exhausted. The fix is twofold: increase the pool size (carefully — each connection has overhead) and ensure connections are always released promptly.
// Always release in finally, even on error
const client = await pool.connect();
try {
  const result = await client.query('SELECT ...', [params]);
  return result.rows;
} finally {
  client.release(); // This MUST run, always
}
[SOURCE: https://node-postgres.com/features/pooling]
Step 5: Implement a Layered Caching Strategy
Once the database layer is clean, caching is the highest-leverage optimization available. I implement caching in three layers:
Layer 1 — Database query cache with Redis:
import { createClient } from 'redis';
const redis = createClient({ url: process.env.REDIS_URL });

async function getCachedUserProfile(userId) {
  const cacheKey = `user:profile:${userId}`;
  const cached = await redis.get(cacheKey);
  if (cached) return JSON.parse(cached);

  const profile = await db.query('SELECT * FROM users WHERE id = $1', [userId]);
  await redis.setEx(cacheKey, 300, JSON.stringify(profile)); // 5-minute TTL
  return profile;
}
Layer 2 — HTTP response caching with Cache-Control headers:
// For public, rarely-changing data
res.set('Cache-Control', 'public, max-age=60, stale-while-revalidate=300');

// For authenticated data — never cache at CDN level
res.set('Cache-Control', 'private, no-store');
Layer 3 — Edge caching at the CDN. For responses that can be cached publicly, I configure Cloudflare or AWS CloudFront to cache at the edge. This eliminates origin server hits entirely for static or semi-static API responses.
Pro Tip: Cache invalidation is harder than caching itself. I use tag-based cache invalidation (Cloudflare Cache Tags or custom Redis key namespacing) so I can invalidate precisely the cached data that changed, rather than flushing the entire cache. A full cache flush under traffic spikes causes a thundering herd problem — every request hits the origin simultaneously.
Step 6: Eliminate Blocking I/O in Async Handlers
Node.js is single-threaded. Any synchronous, CPU-bound operation in a request handler blocks the event loop for every other request. I’ve seen this caused by JSON.parse() on large payloads, synchronous crypto operations, and heavy data transformations inside route handlers.
I profile the event loop with clinic.js:
clinic doctor -- node server.js
If the event loop lag graph shows spikes that correlate with slow requests, I move the expensive operation to a worker thread using worker_threads:
import { Worker, isMainThread, parentPort, workerData } from 'worker_threads';

// In the route handler
const result = await runInWorker('./workers/heavy-transform.js', payload);

function runInWorker(workerPath, data) {
  return new Promise((resolve, reject) => {
    const worker = new Worker(workerPath, { workerData: data });
    worker.on('message', resolve);
    worker.on('error', reject);
  });
}
[SOURCE: https://nodejs.org/api/worker_threads.html]
Real-World Tips I Use in Production
Set query timeouts at the database client level. I set statement_timeout = 5000 (5 seconds) at the PostgreSQL session level. If a query runs longer than that, it fails fast with a clear error instead of holding a connection and blocking the pool.
Monitor p95 and p99, not just averages. Average response time hides tail latency — the worst 1–5% of requests that make users frustrated. In Datadog, I set alerts on p99 > 800ms for critical endpoints, not on average latency.
Use HTTP/2 or connection keep-alive for downstream service calls. If your API calls other internal APIs or third-party services, re-establishing TCP connections on every request adds 20–100ms per call. Use keep-alive agents or HTTP/2 to reuse connections.
Common Errors and How I Fixed Them
Endpoint returns 200 but takes 8+ seconds — almost always N+1 queries or a missing index. Start with EXPLAIN ANALYZE on the slow path.
Intermittent slowdowns with no CPU or memory spike — this is usually connection pool exhaustion. Check waitingCount in your pool stats and look for connection leaks in error paths.
Response times good in staging, terrible in production — almost certainly a query plan difference due to table size. Run ANALYZE on your production tables and check if query plans change between environments.
Redis cache returning stale data after updates — missing cache invalidation. Review every write path and ensure you call redis.del(cacheKey) or redis.setEx(cacheKey, ttl, newValue) on every mutation that affects cached data.
FAQ
Q: Why does my API get slower as the database grows even though I haven’t changed any code?
A: As tables grow, query plans change. An index that was being used on a small table may be skipped by the query planner on a large table if the statistics are outdated, or it may no longer be selective enough to be useful. Run EXPLAIN ANALYZE on your slowest queries and run ANALYZE (or VACUUM ANALYZE) on tables that have grown significantly. Also look for queries that rely on implicit sequential scans — those scale linearly with table size.
Q: What is the N+1 query problem and how do I fix it in a REST API?
A: The N+1 problem occurs when fetching a list of N resources triggers N additional queries to fetch related data — one per item. In a REST API, this typically happens inside loops in your data access layer. Fix it by using JOIN queries (or ORM eager loading) to fetch all related data in a single query. Tools like sequelize-log-queries or Hibernate’s statistics logging can help you detect this pattern automatically during development.
Q: How do I decide what TTL to use for API response caching?
A: The TTL should reflect how often the underlying data actually changes and how stale data would affect users. Static reference data (country lists, product categories) can have TTLs of hours or days. User-specific data typically needs a TTL of seconds to minutes. I start with a 5-minute TTL for most application-level caches and tune from there based on cache hit rates. Use stale-while-revalidate at the HTTP level to serve slightly stale data while refreshing in the background — this eliminates cache-miss latency spikes.
Q: How does connection pool exhaustion cause API slowdowns?
A: A connection pool has a fixed maximum number of database connections. When all connections are busy, incoming requests queue up waiting for one to be released. This queue manifests as high latency on your API — not because the database is slow, but because requests are sitting idle waiting for access. Pool exhaustion is made worse by connection leaks (connections never released in error paths) and by long-running queries holding connections longer than expected.
Q: What is the best way to monitor API performance degradation in production?
A: Use a combination of APM tracing (Datadog APM, New Relic, or open-source options like Jaeger + OpenTelemetry) for distributed traces, database slow query logs with a threshold of 100–200ms, and application-level metrics for p50/p95/p99 response times per endpoint. Set up alerts on p99 latency and error rate thresholds, not just averages. For Node.js specifically, also monitor event loop lag with perf_hooks — a lagging event loop is a leading indicator of performance problems before they show up in response times.
Conclusion
API performance degradation in production is always solvable — but it requires a structured diagnostic process, not guesswork. Start with data from APM and slow query logs, work through the most impactful fixes first (N+1 queries and missing indexes), and layer in caching and async optimizations after the fundamentals are clean
About the Author
I’m a senior software engineer with eight-plus years of experience building and optimizing production APIs in Node.js, Python, and Go. I’ve worked on systems handling millions of requests per day, running on PostgreSQL, Redis, and distributed microservice architectures. I write about the practical, unsexy side of backend engineering — the debugging, the tradeoffs, and the things that only break at scale.