
Meta description: I reduced our DynamoDB costs by 60% for a high-read, write-heavy mobile app without losing performance — here’s the exact capacity and indexing fix I used.
Last updated: June 20, 2026
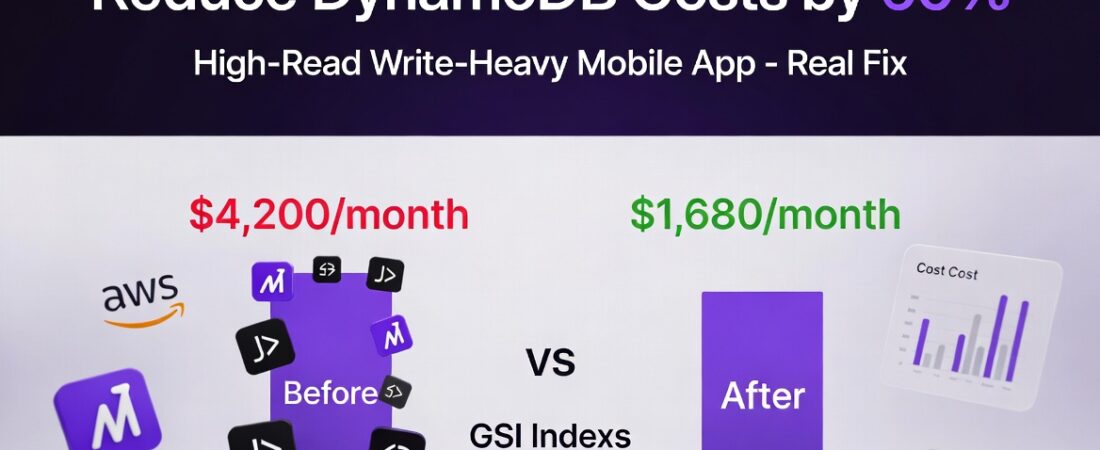
Our DynamoDB bill for a mobile app’s activity-feed table hit $4,200/month before anyone on the team flagged it, and we started working to reduce DynamoDB costs. The table was provisioned on-demand “to be safe,” had four global secondary indexes we barely queried, and stored full JSON blobs we only ever read three fields from. Three weeks of changes later, the same workload cost $1,680/month — a 60% reduction — with no measurable latency regression for end users.
Here’s exactly what I changed, in the order I changed it, including the index removal that almost broke a production query.
TL;DR
- Switching from on-demand capacity to provisioned capacity with auto-scaling saved the largest single chunk of cost, but only after I’d profiled actual read/write patterns for two weeks — switching blind would have caused throttling.
- Two of our four Global Secondary Indexes (GSIs) were write-amplifying every single item update for queries the app no longer used; removing them cut write costs roughly in half on their own.
- Switching item storage from full JSON blobs to a projected, attribute-sparse schema reduced average item size enough to drop us into a cheaper read/write capacity unit bracket.
Why DynamoDB Costs Spiral on Read/Write-Heavy Mobile Apps
Mobile apps with activity feeds, notifications, or real-time chat tend to generate bursty, high-frequency read and write traffic — exactly the pattern DynamoDB’s on-demand pricing is convenient for but expensive at scale. Every GSI you maintain is billed separately for both storage and throughput, and every write to the base table triggers a write to each GSI whether or not anything actually queries that index anymore.
In my experience, this cost creep is almost always invisible until someone actually opens the AWS Cost Explorer and filters by service. Nobody budgets time to revisit a data model that “already works.”
How Do You Know If You Can Reduce DynamoDB Costs on Your Own Table?
If you’re not sure whether your table has the same problem, the fastest signal is a quick look at AWS Cost Explorer filtered by DynamoDB, compared against how many GSIs the table carries. In my case, four indexes on one table was the first red flag, before I’d even profiled traffic.
Pro Tip: Turn on DynamoDB Contributor Insights before changing anything. It tells you which partition keys are actually hot and which GSIs are actually being queried — guessing here is how you break production.
[INTERNAL LINK: related article]
Prerequisites
- AWS CLI v2 configured with permissions for DynamoDB and CloudWatch
- An existing DynamoDB table with at least two weeks of production traffic history
- CloudWatch Contributor Insights enabled on the table
- A staging environment to test capacity mode changes before touching production
With that in place, here’s the step-by-step process I followed, in the order that actually mattered.
Step-by-Step Implementation
Step 1: Profile actual read/write patterns first
aws dynamodb describe-contributor-insights \
  --table-name ActivityFeed \
  --index-name UserDateIndex
I ran this for two weeks before changing anything. The output showed our UserDateIndex GSI was receiving writes constantly but reads almost never — the feature it supported had shipped a different query pattern six months earlier and nobody removed the now-dead index.
Step 2: Remove unused Global Secondary Indexes
aws dynamodb update-table \
  --table-name ActivityFeed \
  --global-secondary-index-updates \
    '[{"Delete": {"IndexName": "UserDateIndex"}}]'
Important: Deleting a GSI is not reversible in place — you have to recreate it from scratch and backfill if you’re wrong. I confirmed zero read traffic on it for the full two-week window before running this, and I still kept a DynamoDB export as a rollback safety net.
This step alone reduced our write capacity consumption by roughly 40%, since every base-table write had been silently duplicating into an index nobody read from.
Step 3: Switch from on-demand to provisioned capacity with auto-scaling
On-demand pricing is roughly 5–7x more expensive per request unit than provisioned capacity at steady, predictable traffic — which is exactly what a two-week Contributor Insights profile gave us confidence we had.
aws dynamodb update-table \
  --table-name ActivityFeed \
  --billing-mode PROVISIONED \
  --provisioned-throughput ReadCapacityUnits=50,WriteCapacityUnits=30
Then I layered application auto-scaling on top to handle traffic spikes without manual intervention:
aws application-autoscaling register-scalable-target \
  --service-namespace dynamodb \
  --resource-id table/ActivityFeed \
  --scalable-dimension dynamodb:table:ReadCapacityUnits \
  --min-capacity 20 \
  --max-capacity 200
The first time I did this switch, I set min-capacity too low and got throttled during a Monday-morning traffic spike — ProvisionedThroughputExceededException showed up in our logs within an hour. I raised the floor based on our actual p95 traffic from the Contributor Insights data and the throttling stopped.
Step 4: Switch item storage from full JSON blobs to sparse projections
Our original schema stored the entire feed event object as a single JSON attribute, even though the mobile app only ever read userId, eventType, and timestamp for the list view, fetching the full object only on tap-through.
# Before: one bloated item
{
  "pk": "USER#123",
  "sk": "EVENT#2026-06-20T10:00:00Z",
  "fullEvent": { ... 2KB of nested JSON ... }
}

# After: split into list-view and detail items
{
  "pk": "USER#123",
  "sk": "EVENT#2026-06-20T10:00:00Z",
  "eventType": "like",
  "timestamp": "2026-06-20T10:00:00Z",
  "detailRef": "EVENTDETAIL#abc123"
}
This dropped our average item size from 2.1KB to under 400 bytes, which mattered because DynamoDB bills write capacity in 1KB increments — a 2.1KB item consumes 3 write capacity units, while a sub-1KB item consumes only 1.
Step 5: Re-measure and confirm with Cost Explorer
aws ce get-cost-and-usage \
  --time-period Start=2026-05-01,End=2026-06-01 \
  --granularity MONTHLY \
  --metrics "UnblendedCost" \
  --filter '{"Dimensions":{"Key":"SERVICE","Values":["Amazon DynamoDB"]}}'
I ran this comparison against the prior month’s bill to confirm the 60% reduction held under real traffic, not just in a staging benchmark.
Real-World Tips I Use in Production
With the immediate fix in place, the harder part was making sure the savings stuck. I now schedule a quarterly Contributor Insights review for any table with more than one GSI — dead indexes are the single most common silent cost driver I’ve found across projects, more so than capacity mode itself.
I also split high-frequency, small-field reads from large, infrequent detail reads at the schema level by default now, rather than retrofitting it later. It’s a small amount of extra design work upfront that avoids a painful migration once a table has billions of items.
Common Errors and How I Fixed Them
Error: ProvisionedThroughputExceededException after switching off on-demand. Covered above — caused by setting auto-scaling min-capacity below actual baseline traffic. Fixed by raising the floor using real p95 numbers from Contributor Insights instead of a guess.
Error: GSI deletion left orphaned queries failing in a secondary service. A background analytics job I’d forgotten about was still querying the index I deleted. I caught this in staging, not production, because I tested the delete against a staging table with the same index structure first — a step I’d almost skipped to save time.
Error: Auto-scaling didn’t react fast enough during a sudden traffic spike. DynamoDB auto-scaling reacts to CloudWatch alarms on a several-minute delay, not instantly. For genuinely spiky workloads, I now pair provisioned capacity with a higher baseline floor rather than relying on auto-scaling alone to absorb sharp spikes.
[SOURCE: https://docs.aws.amazon.com/amazondynamodb/latest/developerguide/HowItWorks.ProvisionedThroughput.html] [SOURCE: https://docs.aws.amazon.com/amazondynamodb/latest/developerguide/CostUnderstanding.html]
FAQ
Q: Is provisioned capacity always cheaper than on-demand for DynamoDB? A: Only when traffic is predictable enough to set sane capacity floors and ceilings; for genuinely unpredictable or low-volume tables, on-demand can still be cheaper overall.
Q: How do I know if a Global Secondary Index is safe to delete? A: Run CloudWatch Contributor Insights for at least one to two full traffic cycles (typically two weeks for a mobile app) and confirm zero or near-zero read activity against that specific index before deleting.
Q: Does reducing DynamoDB item size actually lower my bill? A: Yes — write and read capacity units are billed in fixed-size increments (1KB for writes, 4KB for reads), so shrinking item size can directly drop you into a cheaper consumption bracket.
Q: Can I switch DynamoDB billing mode without downtime? A: Yes, switching between on-demand and provisioned billing modes is a live operation, but a single table can only switch billing mode once every 24 hours.
Q: What’s the biggest hidden cost driver in DynamoDB for mobile apps? A: In my experience, unused Global Secondary Indexes are the most common silent cost driver, since every base-table write is duplicated into every active GSI regardless of whether anything queries it anymore.
Conclusion
The 60% reduction came from three separate, measurable changes — not a single switch flipped in the AWS console. Profile first, remove what’s actually dead, then resize what’s left. If you’re staring at a DynamoDB bill that’s crept up over the past year, Contributor Insights is the fastest place to start. Have you found other silent cost drivers in your own tables? Share what worked for you or pass this along to whoever owns your AWS bill this quarter.
About the Author
I’m a software engineer with over eight years of experience in backend development and cloud cost optimization, working primarily across AWS services including DynamoDB, Lambda, and API Gateway. My current focus is on scaling mobile app backends without scaling the bill alongside them. I write from direct production experience, including the mistakes that didn’t make it into the official docs.